

How is the A/E/C industry doing compared to the overall economy, and how can you apply stock price trends of publicly-traded companies to making better strategic decisions for your own firm?
The A/E/C space operates in a dynamic and ever-changing environment, where market trends, economic conditions, and regulatory developments significantly impact project opportunities and financial viability. By tracking the stock market, firms gain valuable insights into the overall health of the industry, identify potential growth areas, and assess the competitive landscape. PSMJ’s all-new A/E/C equity index allows firm leaders to concentrate on sector-specific performance, evaluating the collective performance of key players and benchmarking their own financial health. Armed with this knowledge, firms can make well-informed strategic decisions, adjust their business plans, and stay ahead of the competition, ensuring long-term sustainability and success in the dynamic A/E/C industry. The PSMJ16 tracks the following 16 companies:
|
• AECOM |
• NV5 |
The companies within the PSMJ16 are traded on multiple exchanges, including the New York, Canadian, Australian, and European Stock Exchanges. To account for this, PSMJ adjusted all currency to USD based on current exchange rates. Then each holding was weighted based on market cap. The result is the all-new PSMJ16 index that will track the public companies within the A/E/C industry. The aggregate index is benchmarked against the SPY ETF (SPDR S&P 500 ETF Trust), which is an exchange-traded fund that aims to track the performance of the S&P 500 index, representing a broad cross-section of large-cap U.S. companies. It is used by investors as a convenient and diversified way to gain exposure to the overall performance of the U.S. stock market and is considered a benchmark for the broader market's health and direction.
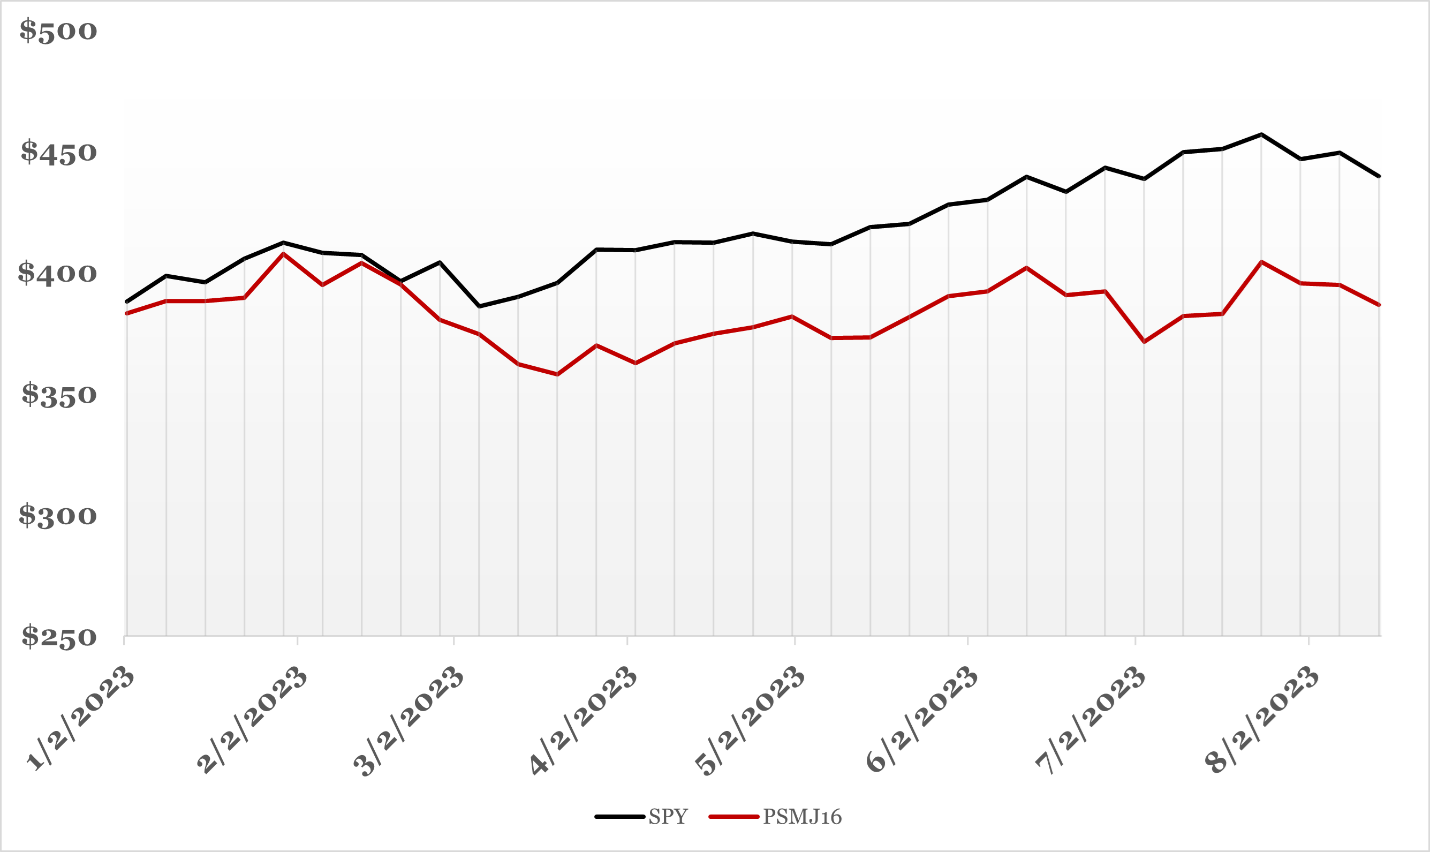
As depicted in the chart, in the year-to-date period, SPY is up 13.3%, while the PSMJ16 is only up by 1.0%. The PSMJ16 has a beta of 0.67, so it is relatively involatile compared to the broader market.