

Earlier this month, I wrote about the importance of getting data from your partner ecosystem (namely account mapping data) into your company’s data warehouse. We’ve seen this subject resonate with partnership leaders and data professionals alike, so I wanted to expand on the topic and share more ways you can put that data into action — including the code required to do it.
In this post, we’ll explore:
- The data schemas you can expect coming out of Crossbeam APIs and our ETL partners
- How best to join that data against your existing CRM data and other data sources in your warehouse
- Sample SQL code for querying the data to create different charts and analyses
- Sample charts and dashboards from numerous BI platforms to show what’s possible once this work is done
The end result is that we actually get to see why we’re doing all this data work in the first place. We’ll leave you with a set of dashboards and charts that can inspire your data team and partner organization to measure partner impact and uncover more revenue from your ecosystem.
The Crossbeam Data Tables
This section contains a summary of the most commonly used tables and fields from the Crossbeam REST API. Our actual API endpoints often provide even more information, and there are also several tables not represented here. For the most current and comprehensive data about our APIs, you can always rely on our Crossbeam Developer Documentation.
We also maintain partnerships with leading ETL providers like Fivetran, Matillion, and Stitch Data, each of whom can save you the trouble of writing code and instead pipe Crossbeam data into your data warehouse directly. The tables and columns you receive from these tools may vary slightly from what you see here, but the structures shown below will be a very close match.
partners
The “partners” table contains a list of each of your company’s partners within Crossbeam. There is one record for each active user at each partner, so you will find multiple records per partner in this table based on how many users they have.
Field | Datatype | Description |
id | INTEGER | Crossbeam-assigned unique ID number used to reference partners in other tables |
uuid | STRING | A larger, universally unique ID. Rarely used. |
name | STRING | Partner company name |
url | STRING | Partner company primary URL |
domain | STRING | Partner company primary URL (cleansed version) |
clearbit_domain | STRING | Domain used to source logo via Clearbit API (where applicable) |
logo_url | STRING | Hard-coded logo URL (where applicable) |
users
The “users” table contains one record for each user at each of your partners. You need to know the users at partner companies in order to initiate Threads and send cross-company communication.
Note that some ETL tools will embed the users records as sub-records within the partners tables. If you can’t find this table, look for extra fields in the “partners” table related to users.
Field | Datatype | Description |
id | INTEGER | Crossbeam-assigned unique ID number |
organization_id | INTEGER | The ID of the partner this user belongs to (foreign key reference to partners.id) |
first_name | STRING | User first name |
last_name | STRING | User last name |
gravatar_url | STRING | URL of user’s Gravatar profile image |
populations
The “populations” table contains a list of your company’s populations. Depending on your ETL provider and how this data is extracted, this table may also contain detailed sub-records about the actual population definition (the data filtering applied to create the population). Past versions and version history may also be available.
Field | Datatype | Description |
id | INTEGER | Crossbeam-assigned unique ID number for this population |
base_schema | STRING | The data source name that this population’s data is based on (e.g. “salesforce”) |
base_table | STRING | The table within that data source that this population’s data is based on |
name | STRING | The population name |
population_type | STRING | The type of data in the population (e.g. “companies” or “people”) |
source_id | INTEGER | The ID of the data source used to pull this data |
partner_populations
This table is similar to the “populations” table, except that it contains all of your partners’ populations instead of your own.
Field | Datatype | Description |
id | INTEGER | Crossbeam-assigned unique ID number for this population |
name | STRING | The population name |
organization_id | INTEGER | The ID number of the partner that owns this population (foreign key reference to partners.id) |
population_type | STRING | The type of data in the population (e.g. “companies” or “people”) |
accounts
This table is a listing of the various “accounts” (i.e. companies) that exist within your Crossbeam data. Typically this is directly pulled from a CRM system, so it should exactly mirror the fields from your CRM. The columns included can expand based on what data you have imported into Crossbeam. Only a small subset relevant for our analyses is included here.
Field | Datatype | Description |
account_created_at | STRING | Timestamp of original account creation date |
account_name | STRING | Company name as stored in your CRM |
account_type | STRING | Usually indicates a relationship type (“Free Trial”, “Customer”, “Churned”, etc.) |
account_website | STRING | Company website as stored in your CRM |
id | STRING | A Crossbeam-generated unique ID for this record |
industry | STRING | One of what might be many firmographic or other property fields about this account |
master_id | STRING | The ID of this field in its native data source, typically your CRM (i.e. Salesforce ID) |
owner_account_executive_email | STRING | The email of the Account Executive who owns this account |
owner_account_executive_name | STRING | The name of the Account Executive who owns this account |
owner_account_executive_phone | STRING | The phone number of the Account Executive who owns this account |
partner_accounts
This table is structurally identical to the “accounts” table above, except that it includes partner account information instead of your account information. The only additional field is a “partner_population_id” field that contains the ID or IDs of partner populations where this record appears.
Flattening the Data with dbt
Rather than write countless JOIN statements to link up all the data tables above every time we want to conduct an analysis, we can use a popular open source tool called dbt (short for “data build tool”) to convert these tables into one flat, singular view containing all the data. We plan to publish universal DBT models via our ETL partners in the future, so check back for code samples and other resources to make this easier.
The output of this model is a very wide, very tall view called “crossbeam_overlaps”. This new view contains one entry for every “overlap” between your data and the data of a partner. It also includes metadata about your data and your partners’ data, such as the account executive who owns the account on each side.
Combining Crossbeam Data with Existing Data
At this point, we have our large, flexible “crossbeam_overlaps” view that contains all of the data in the center of the Venn diagram between you and your partners. There are quite a few analyses you could do with this data, but the real value comes from combining it with other data sources.
Doing this requires JOIN keys that you can use to link your data back to other data sets. Two examples of this practice are shown below.
Joining with Salesforce
If you want to link your “crossbeam_overlaps” data with your Salesforce data, the “master_id” field in your crossbeam_overlaps is the key. This field holds the unique Salesforce account_id value associated with that record, allowing you to combine those fields with a simple join.
SELECT * FROMcrossbeam_overlapsJOINsalesforce.accountsONcrossbeam_overlaps.master_id = salesforce.accounts.id
Appending to Marketing Events
Your data warehouse may contain a marketing events table that tracks things like ad clicks, email opens, website visits, content downloads and more. These tables are very useful for attribution models and identifying the highest-ROI channels for your company. They can be as simple as three columns: account_id, event_type, and timestamp.
Adding partner overlap data into this event list can be quite compelling here because these are also a form of “touch” that may be influential to a deal, particularly in a multitouch attribution model where multiple factors are being considered. You can append this data to your marketing events view with a UNION statement
CREATE VIEW all_eventsASSELECT account_id, event_type, timestampFROM marketing_eventsUNIONSELECT master_id AS account_id, “partner_overlap” AS event_type, created_at AS timestampFROM crossbeam_overlaps
Actionable Partner Data Dashboards
At this point, we’ve been able to do the following:
- Push all of our Crossbeam data into our data warehouse using an ETL tool
- Simplify the data structure of our Crossbeam overlaps into a single table that is rich with data attributes
- Join that data table with numerous other data sources, including our CRM data and our Marketing events data, creating new views
Now the real fun begins! Let’s write some queries against our new, rich data views that can tell us new things about our business and how to make the most of our partner relationships.
The screenshots below are for a dashboard generated with Redash, but the same dashboards could just as easily be built in leading tools like Looker and Tableau.
Ecosystem Sales Impact Dashboard
This dashboard illustrates the impact that your partner ecosystem has on the deals happening in your business.
First, it examines the impact on your recent deals. The dashboard compares deal size, time to close, and close rate for deals where the prospect was a pre-existing customer of one of your partners and those where the prospect was not. As it turns out, deals with “in ecosystem” prospects have a higher close rate, close faster, and are larger in size.

The SQL for charts like these is quite simple with the benefit of our crossbeam_overlaps table. We simply join it to our salesforce accounts table using master_id as the JOIN key. It looks something like this for the ACV chart (this syntax is Amazon Redshift compatible):
SELECT CASE WHEN ppf.customer_overlaps > 0 THEN ’Partner Customer’ ELSE ’Standard Deal’ END as opp_type, AVG(o.amount) as average_deal_sizeFROM salesforce.opportunity oLEFT JOIN salesforce.account a ON a.id = o.accountidLEFT JOIN (select master_id, sum(customer) as customer_overlaps FROM crossbeam_overlaps by 1) ppf ON a.id = ppf.master_idWHERE o.amount > 0AND o.stagename = ’Closed Won’AND ppf.population_type = ‘Customers’GROUP BY 1
Our Sales Impact Dashboard then digs into your highest-performing reps and partners based on your current pipeline. The first chart shows the percentage of each sales rep’s current pipeline that comes from companies who are already customers of a partner. Then, it shows a list of your partners ranked by the total dollars of your pipeline made up of their existing customers.
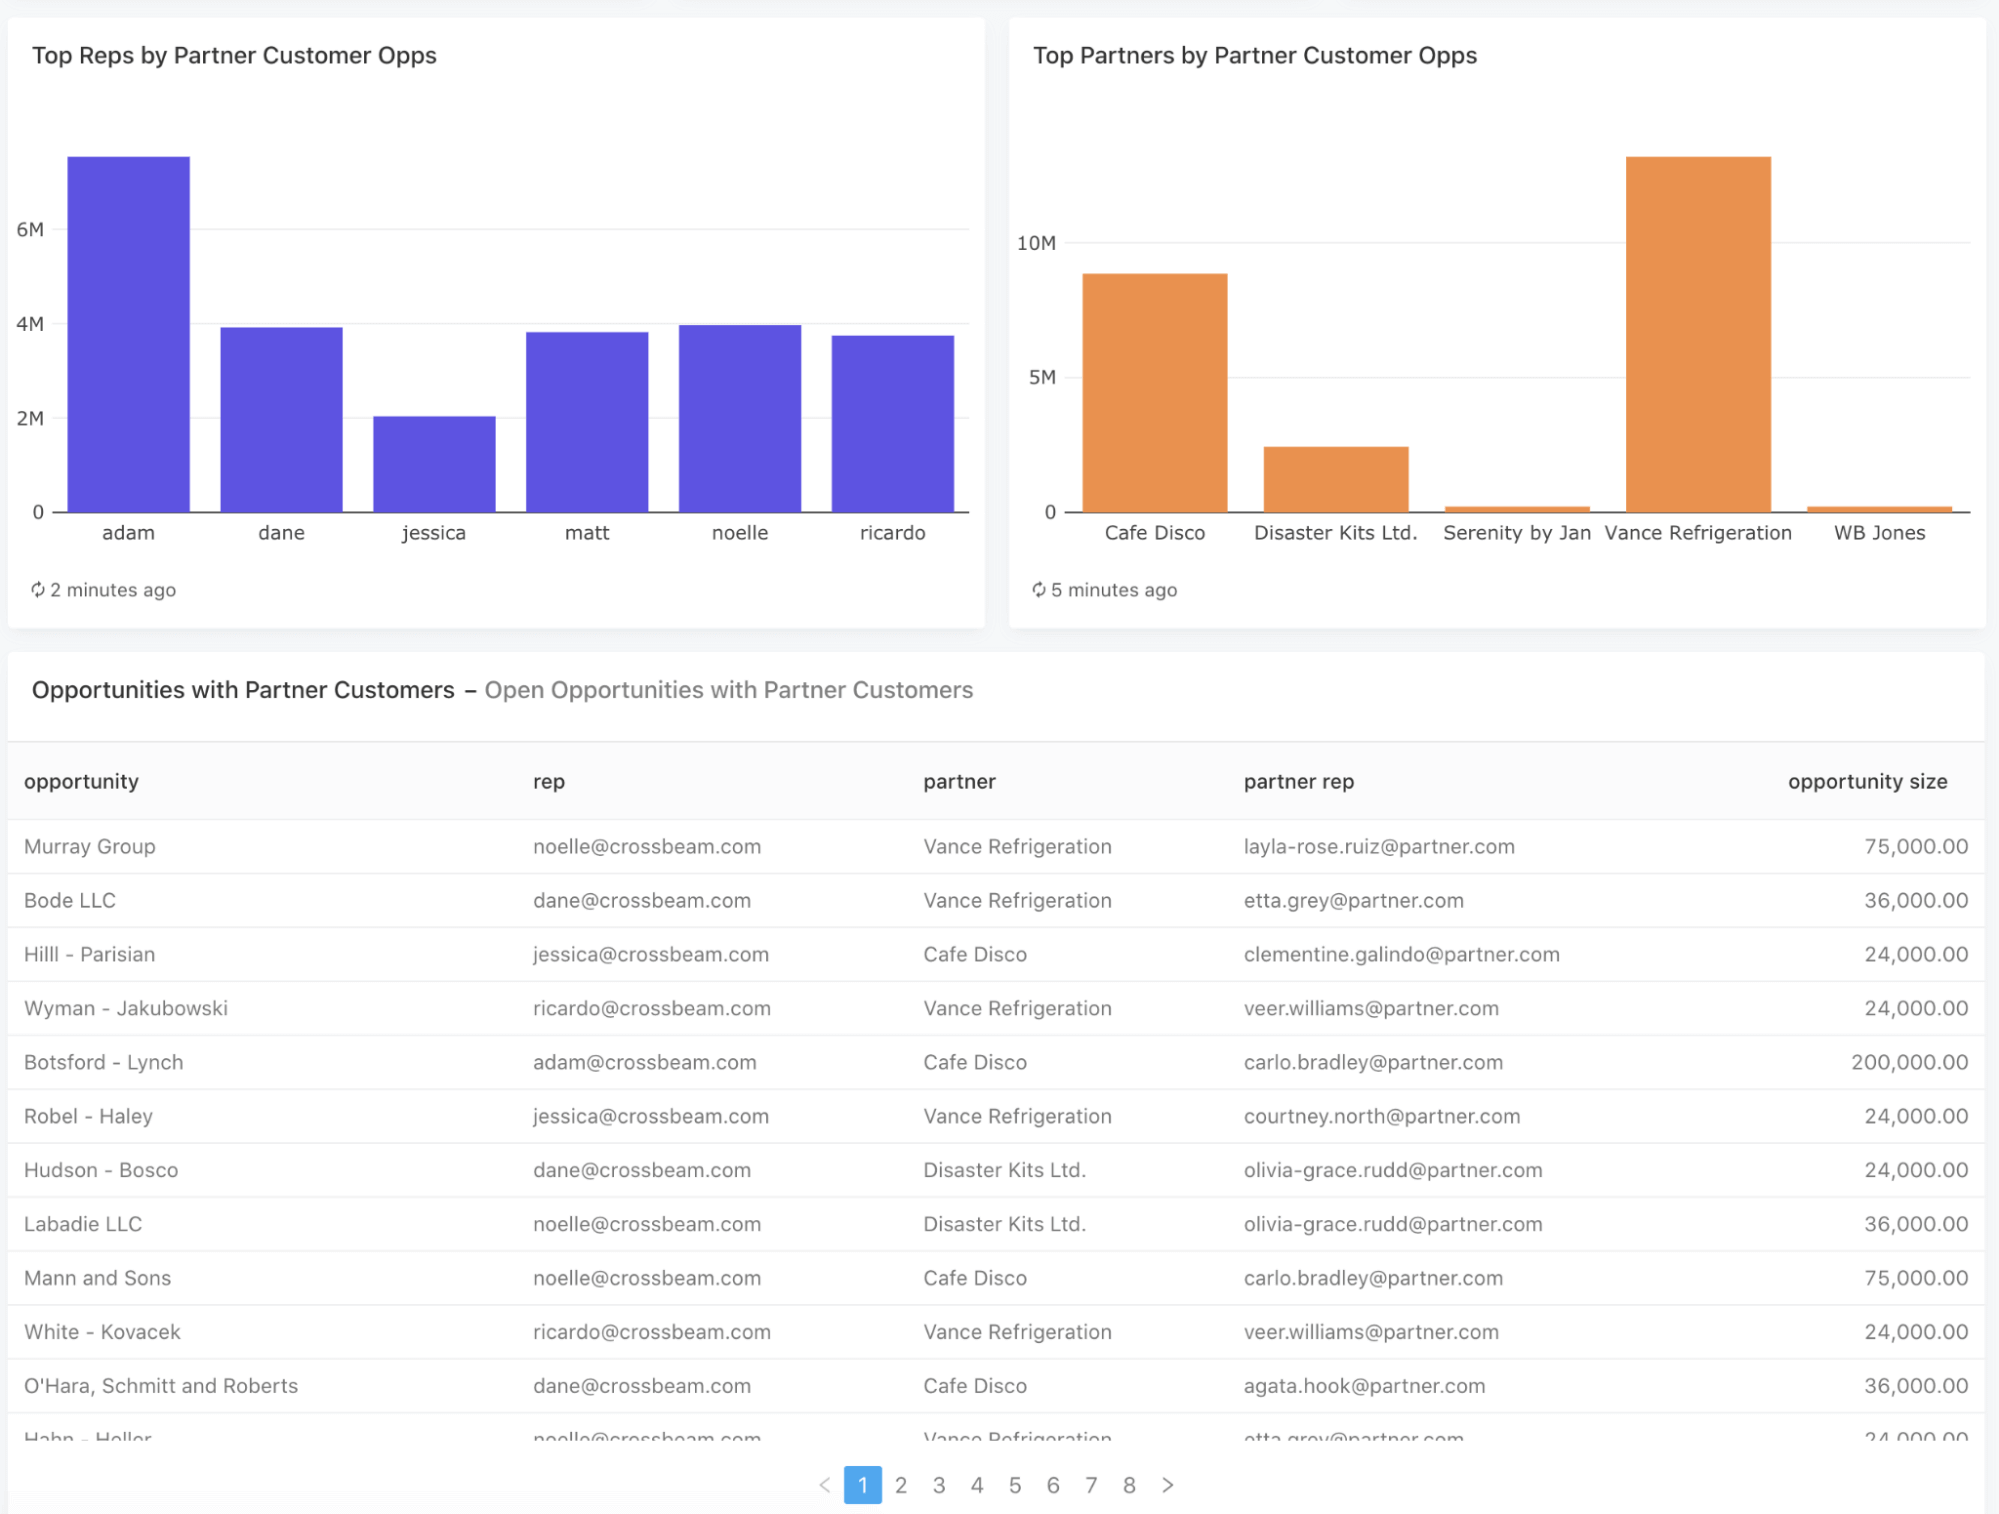
Finally, the dashboard provides a table of all your current open opportunities where a partner relationship exists, allowing you to sort the data by sales rep, partner, deal size, and more.
Sales Rep Dashboard
This dashboard is designed for use by any individual sales rep, and can be filtered to reflect the sales pipeline data for any given rep.
First, it looks at advancing deals where an opportunity is already open. It shows the total dollar value of that rep’s open opportunities (along with the percent of their pipeline that represents) where the prospect is already a partner’s customer. It then lists out all the deals that make up that number along with the information about which partners overlap and who owns the relationships on the partner side.
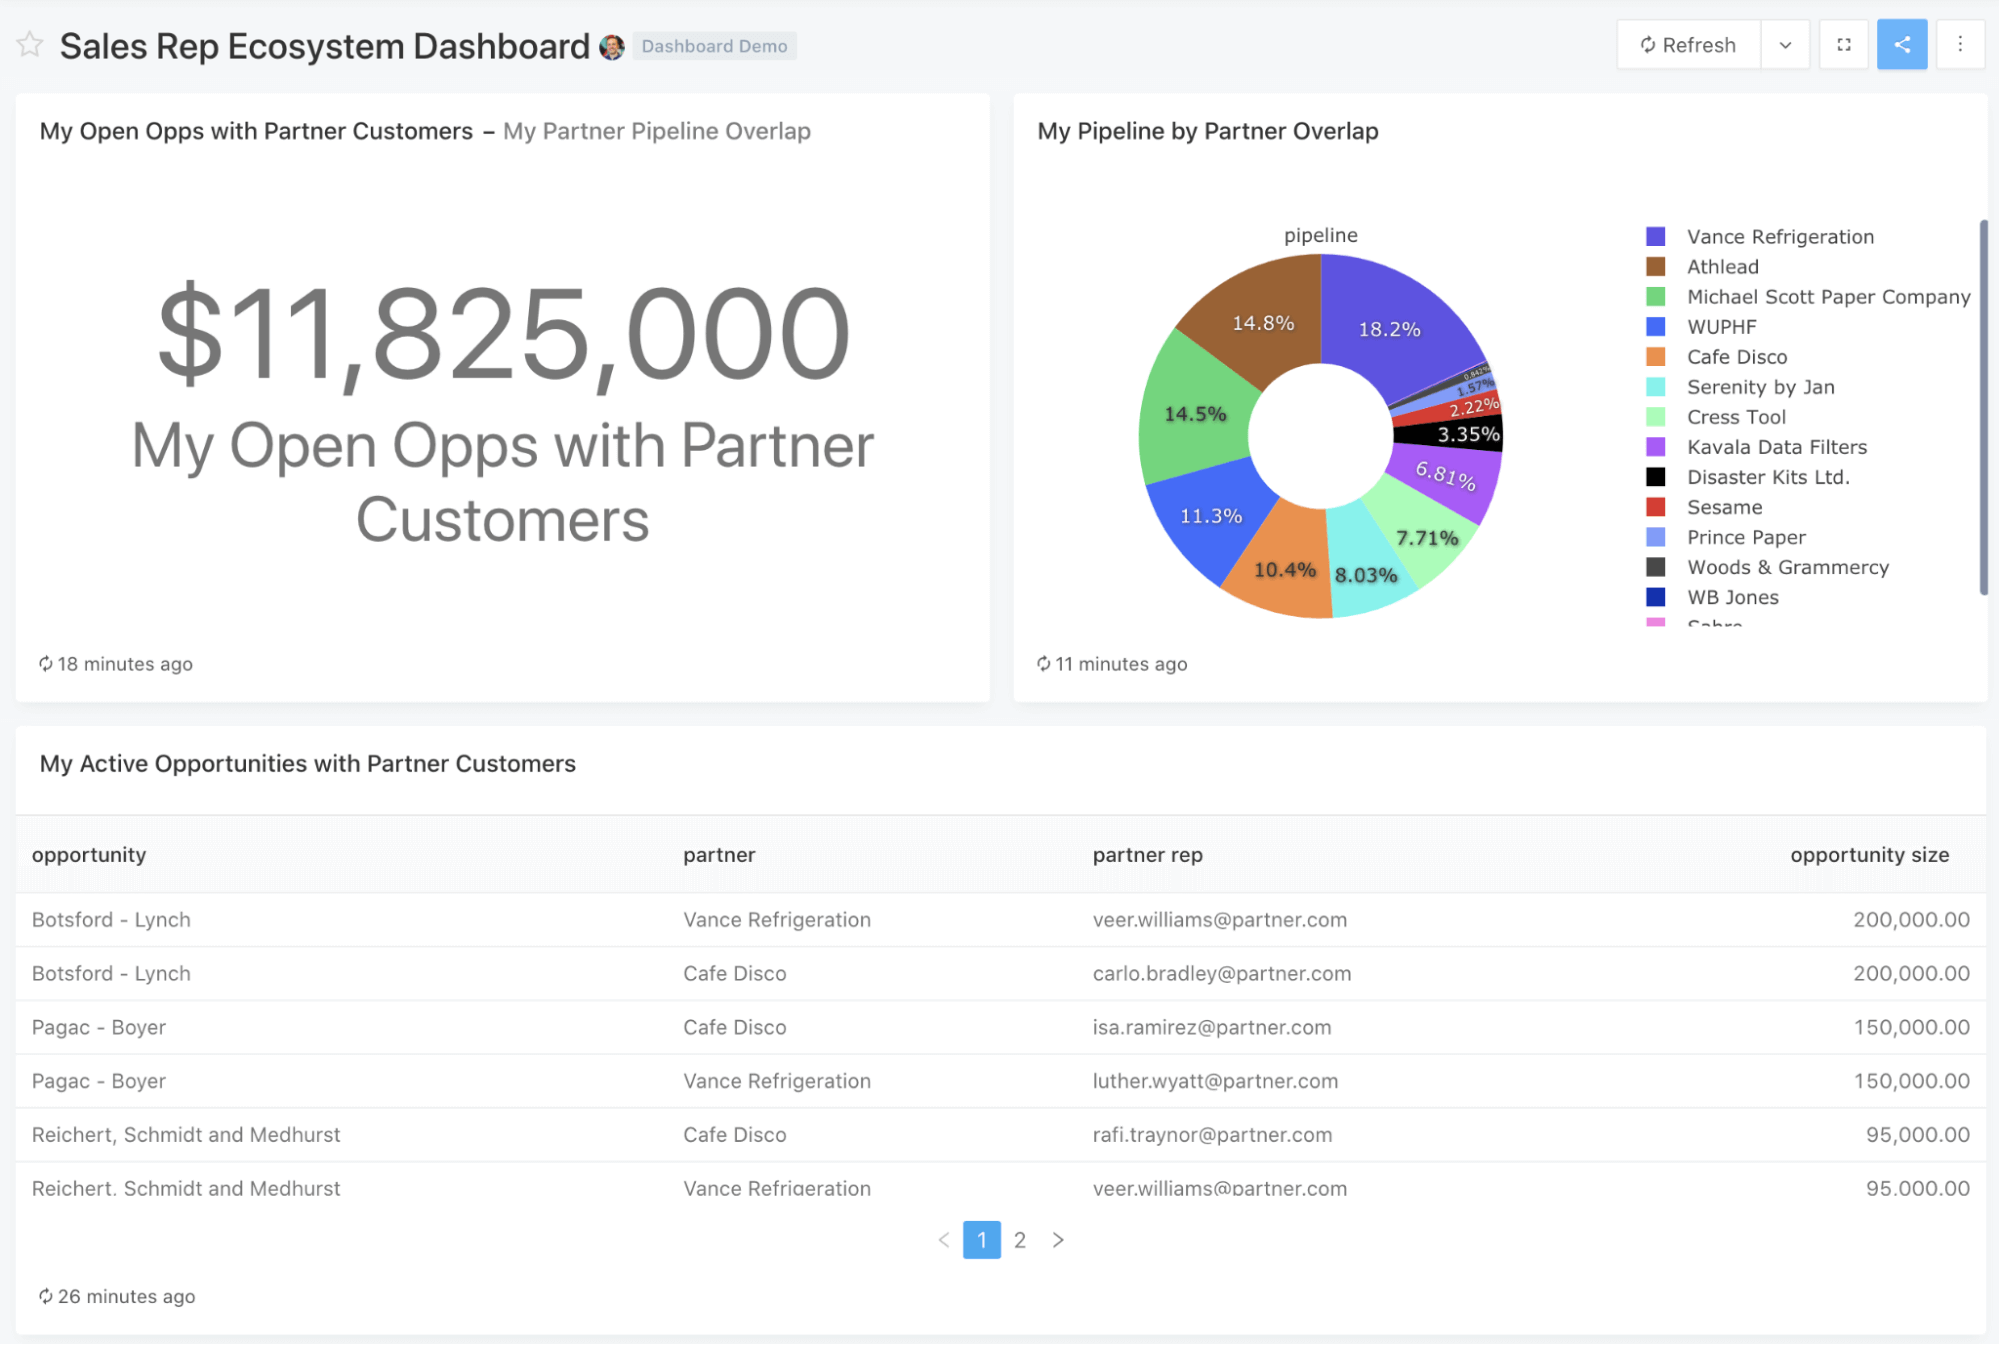
Next, it looks at helping source new opportunities. It analyzes all of the rep’s current owned accounts where there is not yet an opportunity, and looks for cases where the account is already the customer of a partner. For those accounts, it provides information about the partner, the nature of the partner’s relationship, and the person at the partner company who owns that account. This can be an excellent starting point for reps who want to source new leads via partners but don’t know where to start.

Product/CS Dashboard
Partner data can also be used inside the Product and Customer Success organizations to determine how to use partners to prioritize features, case studies, and expansion opportunities.
This dashboard shows you the customer overlap count with each partner. It also highlights which partners are working with your largest (“tier score”) and most engaged (“PQL score”) clients.
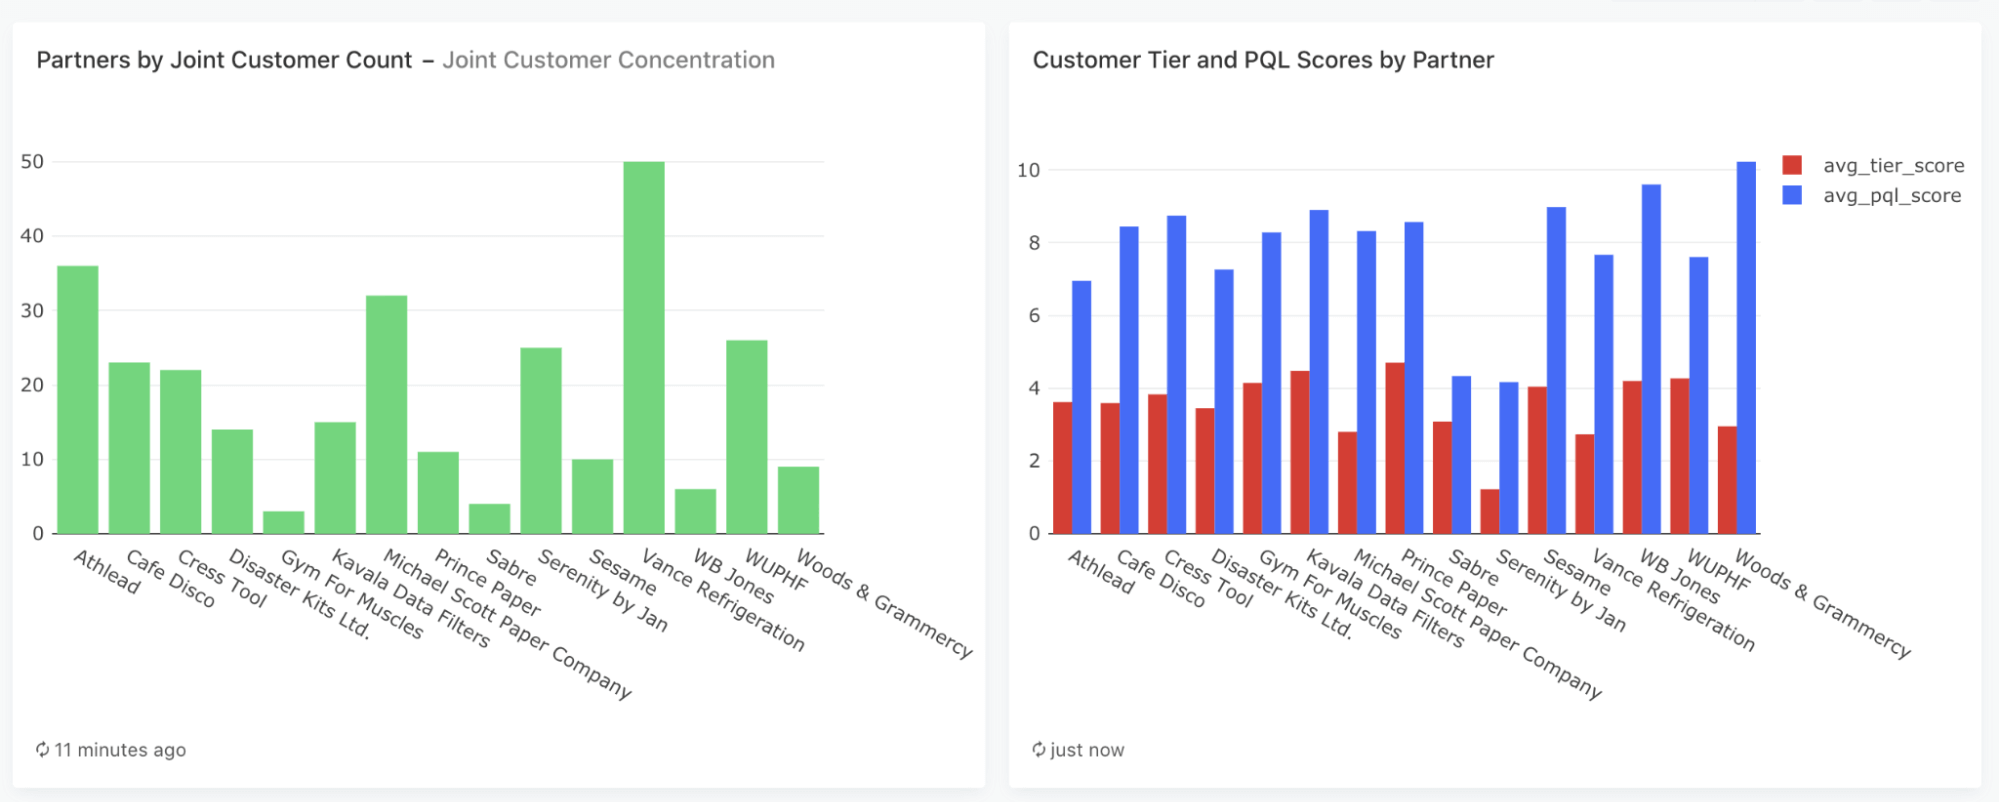
Lastly, it shows a list of existing customers who are also using partner products but are not yet using the integration between your products — an excellent engagement opportunity and a way to boost feature usage.

Multitouch Attribution with Partner Data
This analysis shows what it might look like when you start infusing partner data into your marketing attribution model. Here, we can see “partner overlaps” included in a multitouch model alongside things like content touches and ad impressions. This helps complete the story of how partner relationships play a role in the journey from stranger to lead to opportunity.

Rep Matchmaking Analysis
Some partner teams like to get as much mileage out of each partner connection as possible. With this view, you can study every permutation between one of your Account Executives and the Account Executive at each of your partners. By sorting for the highest number of shared accounts (or dollar values of opportunities on those accounts), you can figure out the highest-value collaborator for each of your reps at any given time.

What’s Next
We’ll continue to invest in making Crossbeam data rich, extensible, and portable so that analyses like these can be a part of every organization. If you’re not on Crossbeam, you can sign up here to get started for free today.


This is a test comment.
This is a longer test comment to see how this looks if the person decides to ramble a bit. So they're rambling and rambling and then they even lorem ipsum.