

Over the last nine years, Prime Day has established itself as the premier shopping date of the summer. Other brands have recently cashed in on this Amazon holiday. During this year’s event on July 11-12, researchers estimated that Amazon topped $12.9 billion in revenue, reflecting a 6.7% increase in sales growth compared to 2022. This growth reveals that despite rising inflation rates, Americans take advantage of the iconic deal days to make purchases, particularly on high-ticket items like electronics.
Eager to capture a share of Prime Day profits, many other retailers launched their deal days in recent years. The ecommerce industry saw a 6.1% jump during this year’s two-day event, reporting $12.7 billion in sales across retailers other than Amazon.
With the right strategy, brands have a massive opportunity to capitalize on the popularity of Prime Day. However, these businesses need data-driven insights to design an effective strategy for the next Prime Day. This impact.com Prime Day Consumer Research compares year-over-year (YoY) Prime Day data to reveal crucial consumer behavior insights that retailers can leverage to hone their strategy for the next Prime Day.
Key research findings
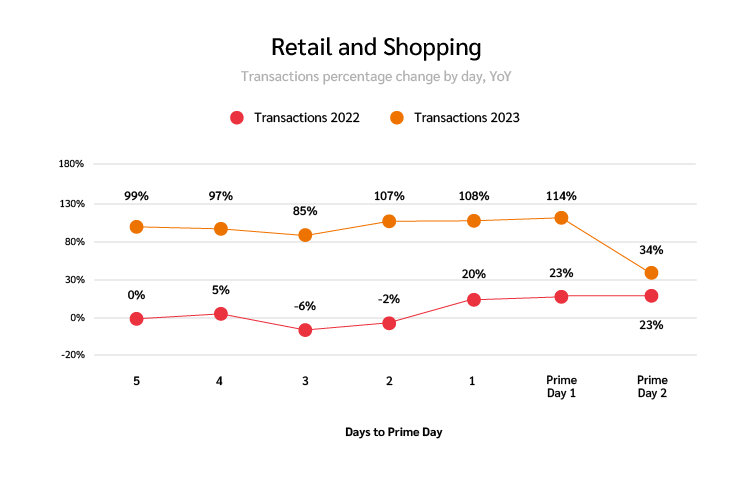
1. Shoppers made 41% more purchases during Prime Day in 2023
This year’s consumer transactions grew 41% over sales recorded in 2022 across all ecommerce brands analyzed during the two-day event.
2. Retailers other than Amazon saw 52% more clicks YoY
Clicks began to increase two days before Prime Day as consumers researched deals across retailers. Reported clicks were 52% higher than the previous year, with slightly more clicks occurring on the first day of the two-day event.
3. Consumers made most of their purchases on July 11th (day one of the two-day sales event)
While transaction volumes rose two days before the Prime Day event, 61% of transactions across all retailers occurred on the first day, July 11th.
4. Average order value dropped by 13% YoY
While customers’ average cart size was smaller this year, consumers still spent more money overall compared to 2022. This trend suggests that customers spread their spending out across multiple online stores, making smaller purchases but more of them.
Methodology
The impact.com Prime Day Consumer Research was conducted by impact.com’s Data Science team. The research tracked and analyzed key metrics across hundreds of North American brands in the retail and shopping industry to compare Prime Day 2023 performance to Prime Day 2022.
Our analysis benchmarked partnership performance metrics like clicks, transactions, average order value (AOV), gross transaction value (GTV), and gross merchandise value (GMV) to analyze Prime Day performance. Researchers tracked these KPIs by comparing same-store, YoY data from brands that actively used the impact.com platform in July 2022 and 2023.
This report uses gross merchandise value (GMV) to the value of goods and services sold over a given period. Gross transaction value (GTV) refers to the amount paid to partners over a given period in exchange for driving the predefined GMV.
This report aims to offer retailers deeper insight into the following:
- How consumers engaged in online shopping during the Prime Day event
- How the economy impacted consumer spending choices in 2023 compared to 2022
- How businesses can capture consumer attention during Prime Day 2024
Interpreting the graphs
Unless otherwise noted, the values shown in each graph represent the percentage change in a metric’s value relative to that value at a specific time, also referred to as the baseline value. Our analysis measures all values relative to the baseline value—five days before Prime Day 2022.
For example:
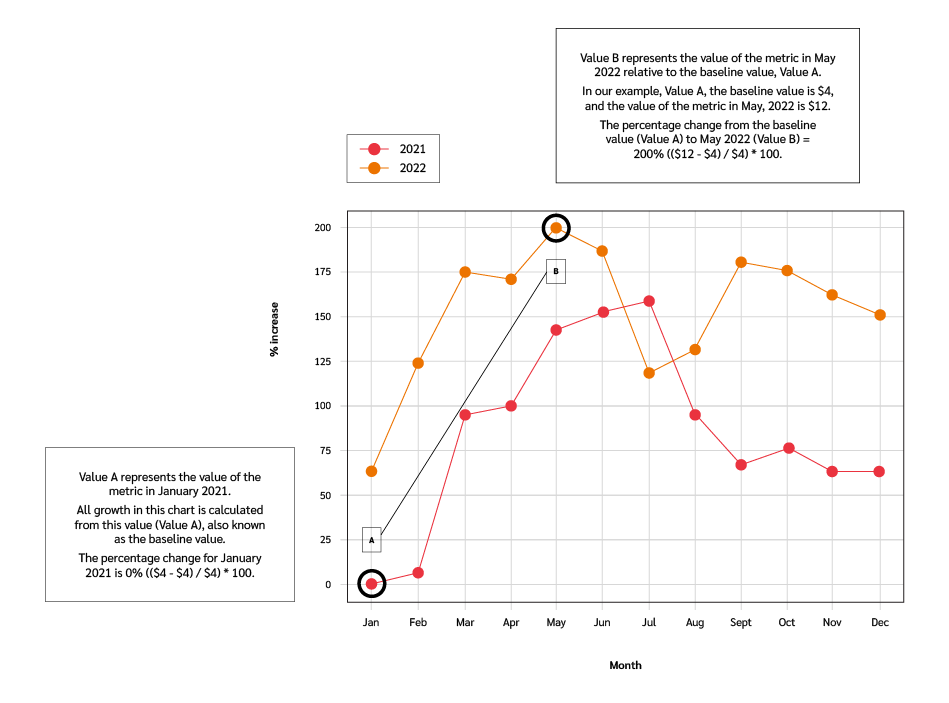
Trends every ecommerce retail and shopping brand should know
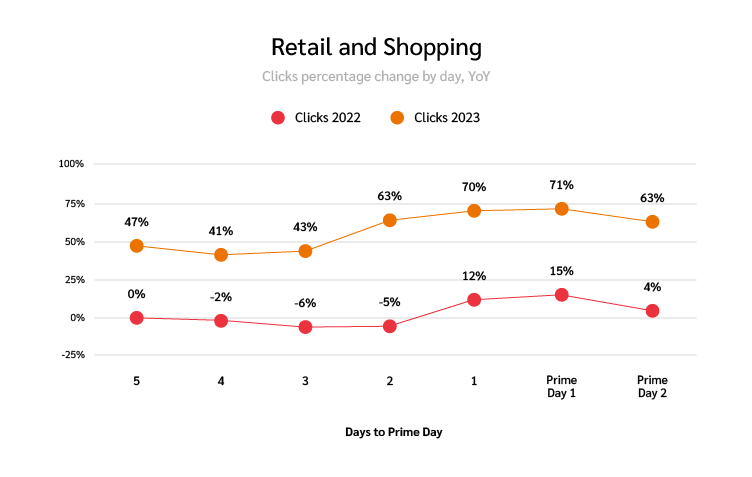
1. Ecommerce clicks increased 52% in 2023
Many ecommerce brands reaped the benefits of shoppers researching products and comparing prices during the Prime Day event.
Data shows that 61% of shoppers planned to research prices before the event, so it’s no surprise that clicks increased two days before Prime Day. This data shows that most shoppers followed through on their intention to research products before Prime Day—consumers are more thoughtful with spending and searching for the best deal.
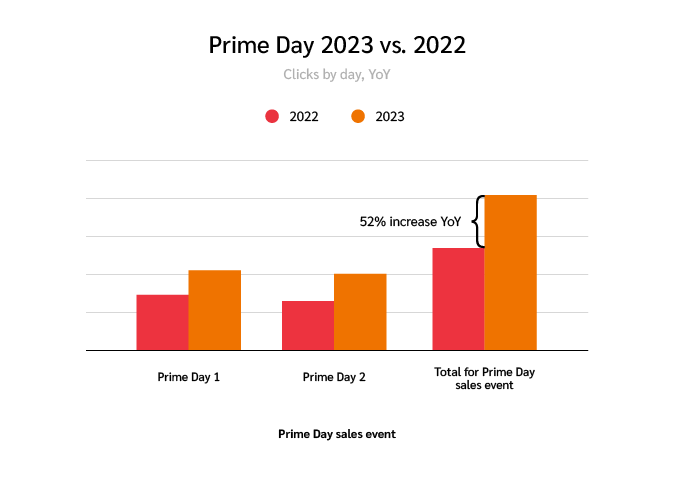
Once the event hit, the two sale days drove a 52% increase in clicks for ecommerce retailers compared to the previous year. Most shoppers visited websites on the first rather than the second day, mirroring last year’s shopping behavior. This increase in clicks reveals that consumers may have done more thorough research this year than last.
2. While the number of transactions increased, clicks drove fewer conversions than last year
Consumers’ careful research may have steered them away from buying. Over half of all consumers reported that the cost of living crisis would likely impact their Prime Day spending in 2023. Also, lower conversion rates over Prime Day reveal that customers didn’t always find the deals they were searching for.
While conversion rates increased 17% YoY on the first day of the event, clicks to conversions sank below 2022 levels on the second day. This number aligns with the increase in transactions recorded on the first day versus the second day in 2023. While total transactions increased 41% YoY, 61% of those transactions occurred on the first day. This difference shows that shoppers planned their carts ahead of time, ready to take advantage of deals on the first day of the sale.
Early deals may have driven customers to complete more transactions before the Prime Day event. This year, transaction volume gained momentum two days before Prime Day—a day earlier than retailers saw a boost in sales last year.
3. Retailers’ Average Order Value (AOV) decreased this year
While there were significantly more transactions across retailers during 2023’s Prime Day event, AOV decreased by 13% compared to 2022. This decrease may be because more online stores offered Prime Day deals and discounts.
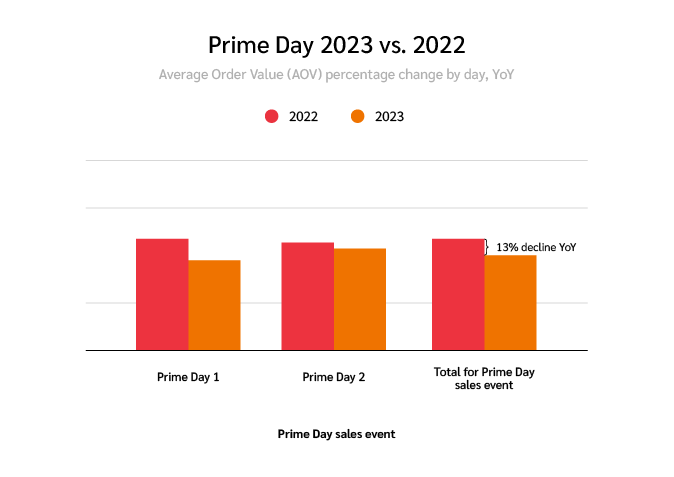
A study by Acadia found that 80% of online stores offered Prime Day deals this year. The research revealed that any promotion around Prime Day increased sales for these businesses. Comparatively, only 69% of the surveyed brands offered Prime Day discounts in 2022. This data implies that most consumers made multiple smaller transactions across retailers rather than one larger transaction at a single retailer this year.
While Amazon reportedly experienced the same slight AOV dip other online shops witnessed— its AOV dropping from $60.73 to $58.41—the ecommerce giant also saw total spend per household increase to $180.82 from last year’s average of $176.71. That may be because 73% of Amazon orders contained only one item, and 25% of households placed more than five orders during the Prime Day event. These households increased the average number of Amazon orders within a household from 2.9 in 2022 to 3.1 in 2023.
4. Brands saw positive growth in GMV and GTV
Many ecommerce brands reaped the benefits of more engaged shoppers. As customers spread their Prime Day budget across multiple retailers this year, brands saw gross merchandise value (GMV) increase by 23% YoY.
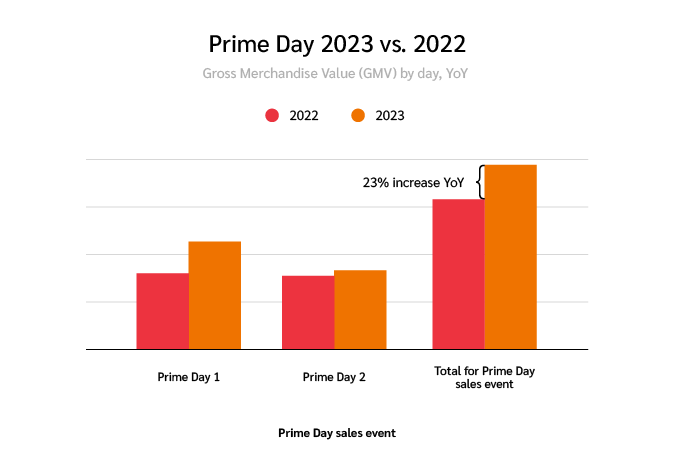
This year, businesses could also attribute more sales to their partners. Gross transaction value (GTV), or the commissions paid to partners, increased by 18% during this year’s Prime Day event. This percentage indicates that brand partnerships allowed businesses to reach new audiences, resulting in more transactions than in 2022.
What did people buy on Prime Day 2023?
The impact.com Data Science team broke down the retail and shopping industry for a closer look into five brand categories.
The categories were:
- Apparel, Shoes, and Accessories
- Arts and Entertainment
- Health and Beauty
- Home and Garden
- Sports, Outdoor, and Fitness
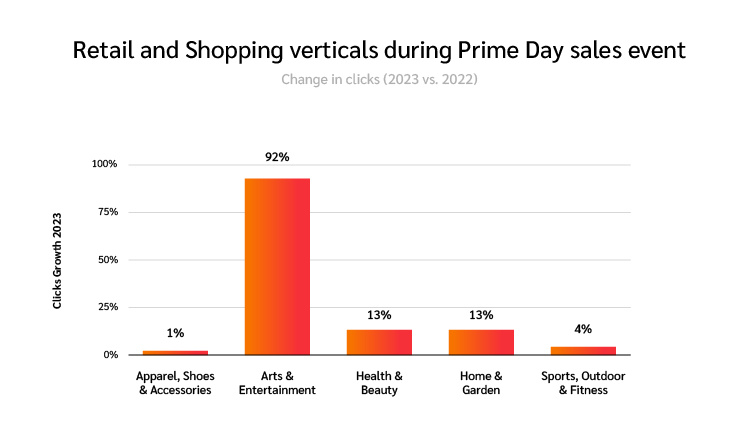
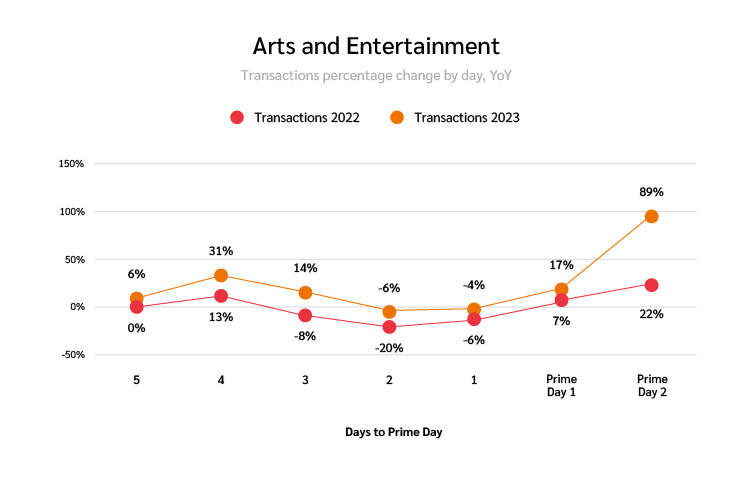
Most of these categories’ clicks only increased marginally from 2022 to 2023. However, Arts and Entertainment saw a massive 92% increase this year. This significant click increase corresponded with a 34% increase in transactions for those brands.
While most verticals experienced a boost in transactions during this year’s Prime Day event, the Sports, Outdoors, and Fitness category noticed a slight dip in transactions. Despite fewer transactions, the vertical saw an 11% boost in GMV due to their 17% increase in AOV.
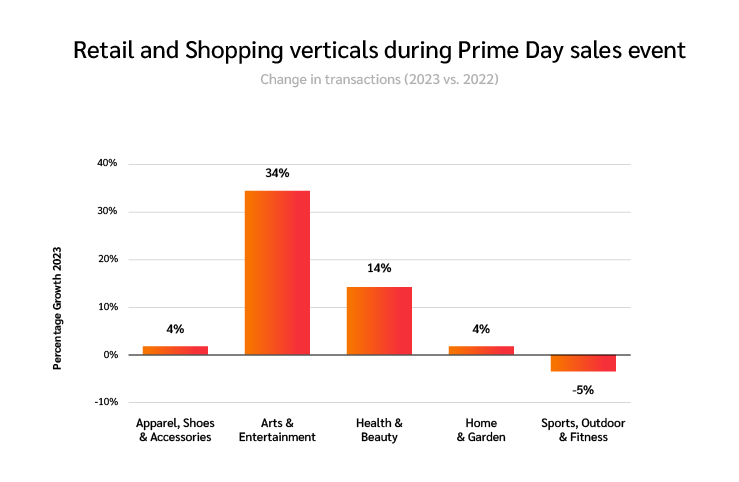
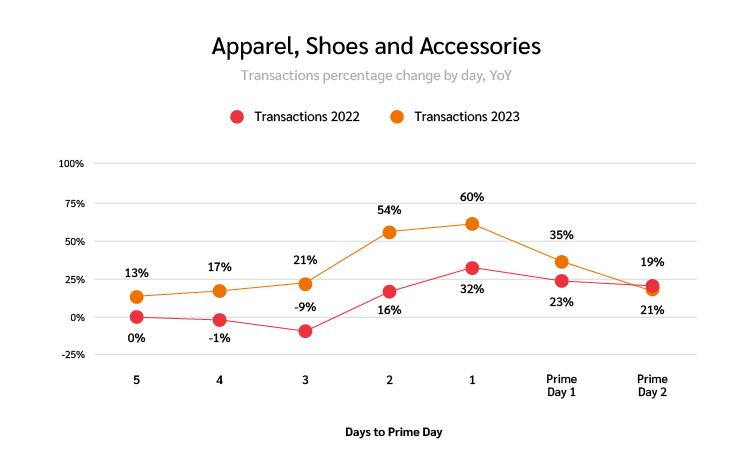
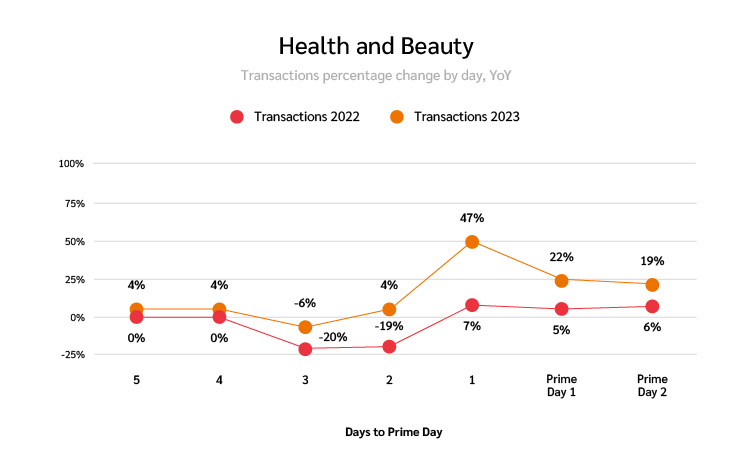
Additionally, ecommerce brands selling Health and Beauty or Apparel, Shoes, and Accessories had higher transactions this year. While Health and Beauty experienced an increase in click rate, clicks remained steady for Apparel, Shoes, and Accessories brands. Both verticals experienced the most transactions the day before Prime Day began, signifying that brands within these categories may have offered their best discounts on July 10.
Furthermore, online stores within the other three categories experienced a boost in transactions on the second Prime Day. Arts and Entertainment brands saw a whopping 89% more transactions on the second day compared to the baseline value in 2022, signifying that these retailers may have capitalized on urgency by promoting more compelling deals on day two.
Ecommerce brands get a sales boost on Prime Day 2023
Although the AOV for Prime Day 2023 was lower than in 2022, clicks and purchases substantially increased. This difference could indicate that shoppers were careful with their spending but more eager to cash in on Prime Day deals in 2023 vs. 2022.
Use impact.com’s Prime Day Consumer Research to optimize your marketing and partnership efforts for the next Prime Day.
Ready to create successful partnership relationships for your next big shopping event? Schedule a demo to see how impact.com can get you started.